by Alison Hewitt
Originally posted in the UCLA Newsroom
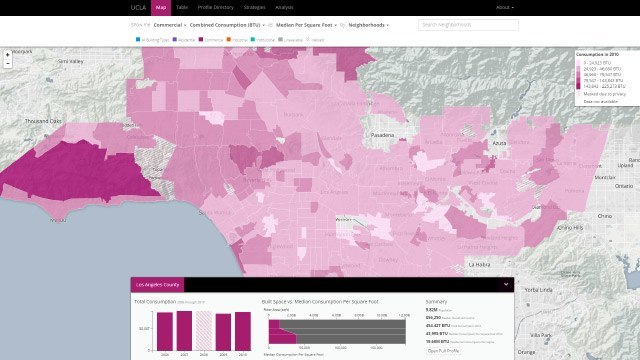
UCLA researchers launched their new L.A. Energy Atlas today, a free searchable database that combines never-before-released data from energy utilities with public records to reveal previously undetectable patterns about how people, buildings and cities use energy.
Researchers from the California Center for Sustainable Communities at UCLA have assembled information in a database that allows users to sort it by household income; building age, size or use; city or neighborhood; energy use per square foot; energy use per capita; and other metrics.
“Buildings emit almost 40 percent of a city’s greenhouse gases, but until now we didn’t have much detail,” said UCLA professor Stephanie Pincetl, head of the Energy Atlas project. “It was the equivalent of knowing that cars produced greenhouses gases, but not knowing the emissions difference between a diesel truck and a hybrid car.”
The researchers are beginning to analyze data. The atlas reveals for the first time that the most inefficient buildings in the county aren’t the oldest, but structures from the 1970s. Users of the atlas will find that residents of Malibu use the most energy per capita and the denizens of Avalon on Catalina Island use the least. And while homes in many low-income neighborhoods are less efficient per square foot than homes in wealthy neighborhoods, well-off neighborhoods use more energy per person. For example, the average person consumes 10 times as much electricity in Malibu as in Bell, and countywide, wealthy areas consume more than three times as much energy as poor areas. Users cannot view data on individual buildings, but can arrange data on a number of geographical scales, including countywide, city by city, and as small as a census block.

“Before now, only utility companies had the energy-usage data — not rate payers, not renewable-energy advocates, not city governments — and even the utilities did not connect it to the full range of variables in the atlas,” said Pincetl, director of the California Center for Sustainable Communities and a professor-in-residence at the UCLA Institute of the Environment and Sustainability. “This is a breakthrough that makes it possible to understand the energy-use landscape in a way that still protects privacy.”
The researchers designed the atlas for collaboration with local governments, state policy makers, non-profits, researchers and other stakeholders to craft data-driven, energy-saving policies that protect the environment. By illuminating the differences in how people, buildings and neighborhoods use energy, the Energy Atlas shows that a one-size-fits-all policy on energy reduction would not be equitable or cost effective, the researchers said. Different strategies are needed to address wealthy areas consuming the most energy per-capita, versus low-income houses which are often less efficient.
Local governments’ enforcement power over building codes and permits means they shoulder much of the responsibility of California’s greenhouse-gas reduction goals. The atlas gives local governments reliable data to establish baselines and evaluate the effectiveness of programs, said Howard Choy, the general manager of the Los Angeles County Office of Sustainability, which provided $500,000 to fund the atlas and further supported the project with the promise of using the data to design future energy policies.
“The L.A. Energy Atlas is a resource with the capability to transform local government energy planning efforts,” Choy said. “Until now, this level of information has been difficult to access, and impossible to connect with actual land use conditions. L.A. County will use the information from the Energy Atlas to inform energy programs and shape future policies.”
The Energy Atlas includes assessor records, census data and electricity and natural gas usage from 2006-2010 for all of Los Angeles County, with the exception of five cities — Azusa, Cerritos, the City of Industry, Pasadena and Vernon — where the researchers were unable to obtain data from the smaller utilities serving these areas. UCLA researchers have long argued that transparency around utility information is critical for making smart decisions and investments on energy policy, and all the more so because many energy-saving incentive programs are publicly funded.
“The database links energy usage to building characteristics and really allows the user to slice-and-dice the data,” said Zoe Elizabeth, project director of the atlas and associate director of the California Center for Sustainable Communities. “Energy data has not historically been released at this level of detail, so for UCLA to gain access and make it transparent to everyone is a huge shift.”
The California Center for Sustainable Communities is endowed by the Pritzker Family Foundation. The Energy Atlas team’s web development was assisted by Studio NAND, and the project was supported by the Southern California Regional Energy Network, the California Energy Commission’s Public Interest Energy Research grants, the Los Angeles County Office of Sustainability, the Los Angeles Regional Collaborative for Climate Action and Sustainability, and The Energy Coalition.
