It’s Safe to Breathe
Winter 2017: Week 8 - Air Quality
By Jonathan Tedjakusnadi
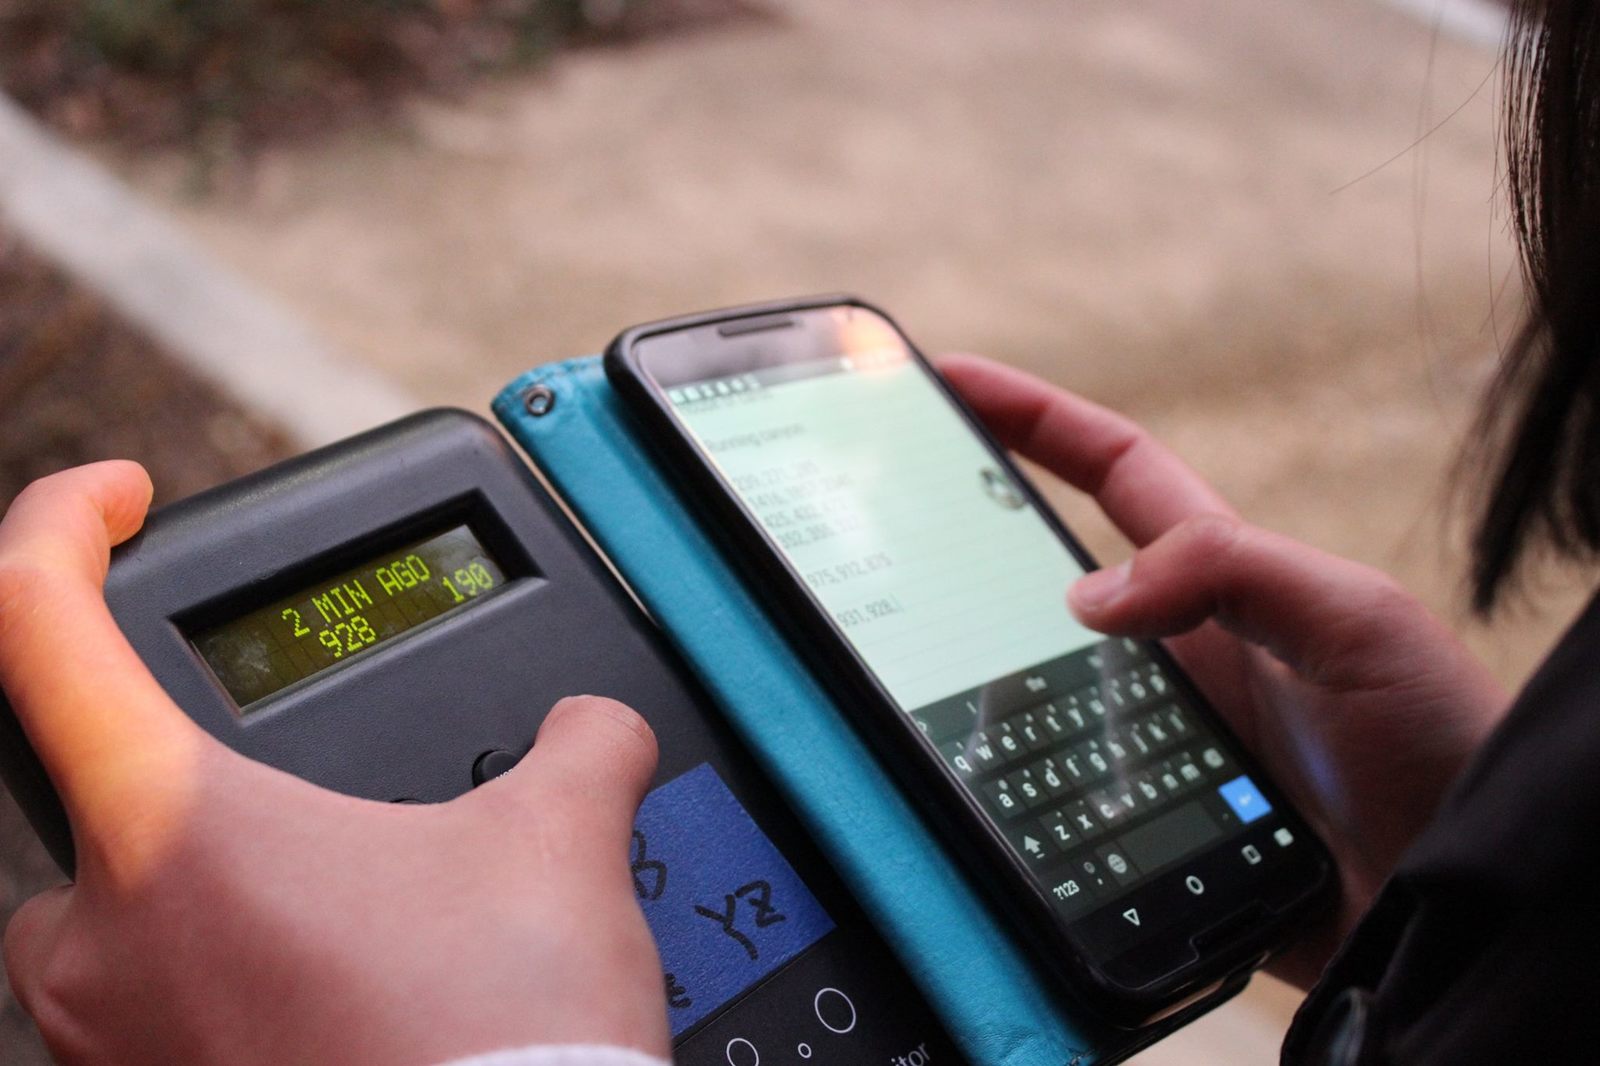
Air quality – It may not have been as bad as we thought. As we began plotting out our data, we noticed fluctuating points on a few measured days that reflect concerning levels of PM2.5. However, these data points were observed across the board between both BFit and John Wooden Center. This is an indicator that the cause might be an outdoor ambient air quality issue causing such an elevated concentration of PM2.5 rather than an internal circulation issue. As a result, we’ve decided to double down and add an outside measurement to our data points to help determine whether these instances of elevated concentration are a result of mechanical or natural circulation. We are now measuring at fixed points outside both recreational areas. Despite these few occurrences, most of the data is leaning towards relatively clean air.
With a large portion of our data suggesting that the air quality is within a reasonable range, our team has begun to brainstorm ideas to use this data effectively. One idea that came to mind in our weekly meetings was to limit the rate of circulation in JWC. Our meeting with the building engineer informed us that the air conditioner was blasting at maximum capacity 24 hours of the day. If our data shows that air quality is within an acceptable range, one suggestion to improve sustainability would be to limit energy usage in JWC by limiting circulation during times of low user traffic. This will be something that we will be looking into next quarter or possibly frame as a new SAR project for the next school year.