By Ileana Callejas
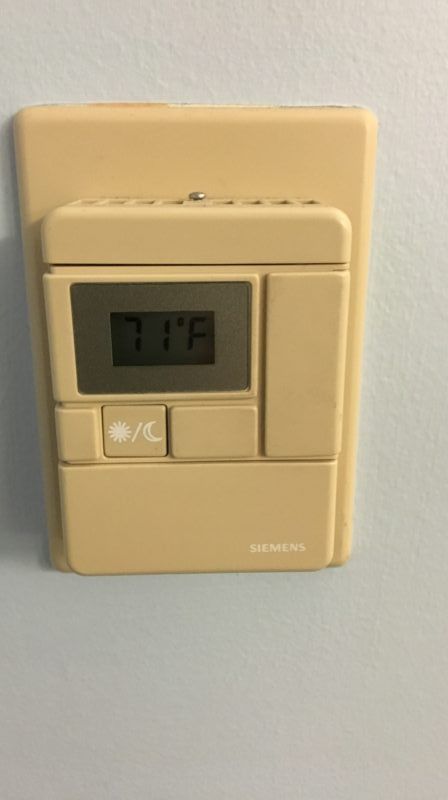
It’s getting hot! As the ambient temperature increases, we need to turn down our thermostats to cool down. A new unit we’ve been introduced to through Pauley Pavilion’s utility records actually measures the number of days in the month that the building is cooled or heated by one degree. This interesting unit is called a degree day and the heating and cooling degree days for Pauley Pavilion were given to us along with other utility records like water, electricity, and steam. Each of these utilities is measured in different units that are new to some of us and we’ve collaborated on how to make them more understandable. When first explaining degree days, our stakeholder told us to imagine it as a way to compare the temperature outside to what we consider to be a comfortable temperature. Changing the thermostats by even one degree has the ability to consume resources that may not be necessary if the temperature outside is already within this comfortable range.
After receiving data concerning the utilities maintaining Pauley Pavilion, it’s now our mission to construct visually appealing and enlightening graphs to display how the cost and consumption have fluctuated over the course of 20 months. At a first glance, the numbers seem to increase and decrease in a sinusoidal manner which is expected with the different demands brought about with each season. Our stakeholder suggested using stacked bar graphs and to compare the records to benchmark-based, whole-building energy performance targets among the other universities in the UC system.
