Story
On water sustainability, L.A. County earns C+ from UCLA environmental report card
Los Angeles County’s grades are in, and UCLA’s latest environmental report card gives the region an overall passing C+ mark for water sustainability.
Dismal grades for polluted groundwater and water bodies like the Los Angeles River brought down the overall average grade in the 2019 Sustainable LA Grand Challenge Environmental Report Card for Los Angeles County on Water.
But with the county’s Measure W expected to generate $300 million annually for stormwater capture and cleaning projects starting in 2020, the UCLA researchers see reason to believe that there will be improvement in a few of the most problematic areas.
“The Los Angeles we know today exists only because of vast water infrastructure that takes water from hundreds of miles away and pumps it here,” said Cassie Rauser, an author of the study and the director of the UCLA Sustainable LA Grand Challenge. “With L.A. getting hotter and rain becoming more unpredictable throughout the state, we need to move to more dependable, drought-resistant local water sources.”
Felicia Federico, executive director of the California Center for Sustainable Communities at UCLA and the report’s lead author, said the county would have a long way to go to earn an A grade.
“The report card underscores the scope and complexity of considerations around sustainability,” she said. “Creating a local and sustainable water system for all of Los Angeles County will require new collaborative approaches and systems-thinking, as well as vast improvements by state agencies in data management and public access.
“Recent commitments from the city and county to source more water locally and new investments in stormwater projects should help bring up grades, but there is a lot of work ahead.”
The UCLA report, which is intended to be updated every few years, is the only comprehensive analysis of the state of the region’s water systems. Researchers analyzed 20 indicators across eight categories, and assigned grades ranging from B+ for drinking water quality and beach water quality (although the drinking water grade was an “incomplete,” according to the report) to D/incomplete for surface water quality.
A category-by-category look:
Water supply and consumption: C+
- Approximately 60% of water used in Los Angeles County is imported from hundreds of miles away. In the city of Los Angeles, 90% of water is from outside the region. Importing water from far away sources strains water supplies in other regions, uses a significant amount of energy and leaves the region’s water supply vulnerable to disasters like earthquakes.
- The volume of reused water increased by approximately 31% from 2006 to 2016.
- Between 2000 and 2017, overall per capita water demand dropped by more than 27%. However, following the April 2017 declaration that California’s drought had ended, urban water consumption increased by between 3% and 4% in 2017.
Drinking water quality: B+/incomplete
- Nearly everyone in the county has been provided with clean drinking water. But even properly treated water can be contaminated by chemicals like lead as it moves through old pipes inside buildings. The report notes that more testing is needed at the tap.
Local water infrastructure: C+
- The county’s water infrastructure is aging, but state and local jurisdictions have invested in reducing water loss, decreasing sewage spills, and improving water capture and infiltration.
Groundwater: C-
- Although the county has significant groundwater resources, inland groundwater is under threat from pollution and coastal aquifers are threatened by contamination from seawater intrusion.
Surface water quality: D/incomplete
- The majority of the county’s water bodies are polluted and unsafe for recreation, drinking water supply or habitats for aquatic life. Because the most recent data on surface water quality available from the California State Water Resources Control Board is from 2010, it’s unclear whether pollution has gotten better or worse in the last decade.
Industrial and sewage treatment plant discharges: B-
- The quality of treated waste that goes into the ocean has improved over the past few decades, but there is still room for improvement in the interest of protecting human health and coastal ecosystems.
Water-energy nexus: C+
- Pumping water from distant sources is energy-intensive. The State Water Project, which pumps water from Northern California to Los Angeles, is the county’s most energy-intensive water source.
- The county decreased its overall water supply-related greenhouse gas emissions by 33% between 2010 and 2016, primarily by shifting away from energy generated from coal to power the pumps.
Beach water quality: B+
- Beach water quality tends to be excellent during dry summer weather and poorer during wet weather, when precipitation sends contaminants coastward.
The report’s other authors are recent UCLA graduates Anne Youngdahl and Sagarika Subramanian, and Mark Gold, UCLA’s former associate vice chancellor for environment and sustainability. Other contributing authors are UCLA graduates Sonali Abraham, Melanie Garcia, Jamie Liu, Stephanie Manzo and Mark Nguyen.
The water report card is the third in a series of environmental report cards — other studies have analyzed the region’s overall environment and energy and air quality — produced by the UCLA Sustainable LA Grand Challenge, an initiative that aims to transition Los Angeles County to 100 percent renewable energy, 100 percent locally sourced water, and enhanced ecosystem health by 2050. The environmental report cards measure progress toward these goals.
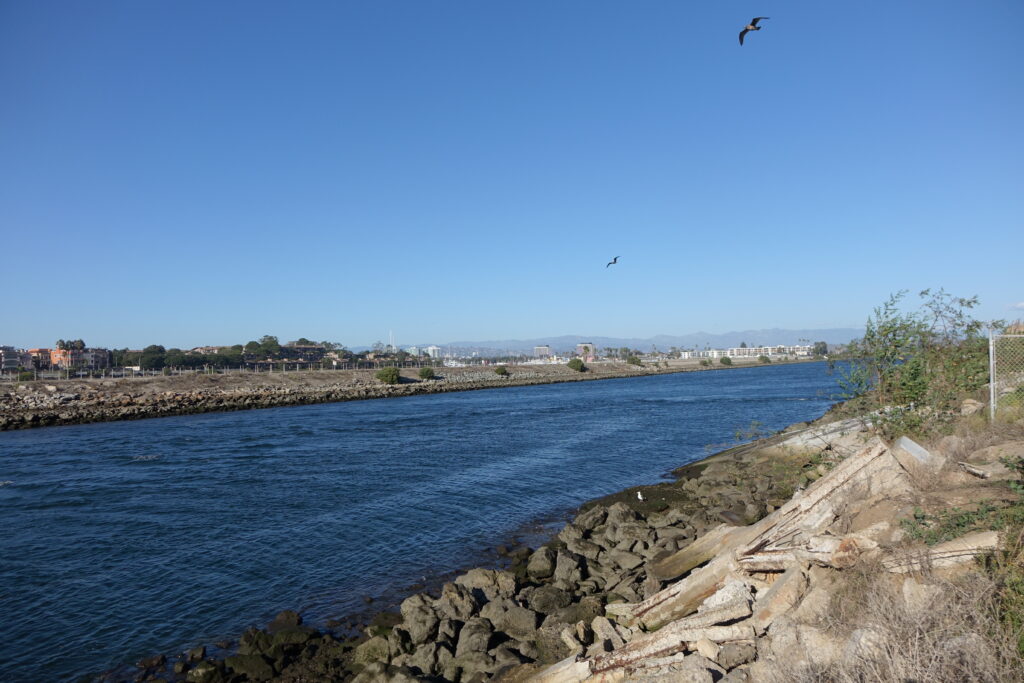
Top image: Ballona Creek in Los Angeles. | Photo courtesy UCLA Sustainable LA Grand Challenge.


